When PostgreSQL becomes slow after a migration, start by comparing query execution plans, refreshing planner statistics, verifying indexes, and measuring CPU, memory, storage latency, and connection activity on the destination server. Use pg_stat_statements to identify expensive queries and EXPLAIN (ANALYZE, BUFFERS) to inspect their execution. Apply one evidence-based change at a time, then validate the result against a representative workload.
Key Takeaways
- Refresh planner statistics: Run ANALYZE after a bulk data migration so PostgreSQL can make informed query-planning decisions.
- Compare execution plans: Use EXPLAIN (ANALYZE, BUFFERS) to identify expensive plan nodes, row-estimation errors, and buffer activity.
- Verify indexes: Compare index definitions, constraints, index usage, and query predicates between the source and destination databases.
- Measure infrastructure performance: Compare CPU utilization, available memory, storage latency, throughput, and network round trips.
- Validate every optimization: Record baseline latency and throughput, change one variable, and rerun the same representative workload.
A successful PostgreSQL migration establishes data availability, application connectivity, and operational continuity. Consistent database performance requires an additional step: verifying that the destination environment executes the same workload efficiently.
A database can return the correct results while taking longer to execute familiar queries. Changes in PostgreSQL versions, planner statistics, index definitions, configuration parameters, storage characteristics, connection pooling, and application behavior can all influence execution time.
For DBAs, the most effective approach is to treat post-migration tuning as a measurable investigation. Start with the queries and transactions that matter most to the application, compare the source and destination environments, and use execution plans and system metrics to isolate the cause.
This guide provides a practical workflow for diagnosing slow PostgreSQL queries after migration, improving database performance, and validating each change with repeatable measurements.
Why Is PostgreSQL Slow After Migration?
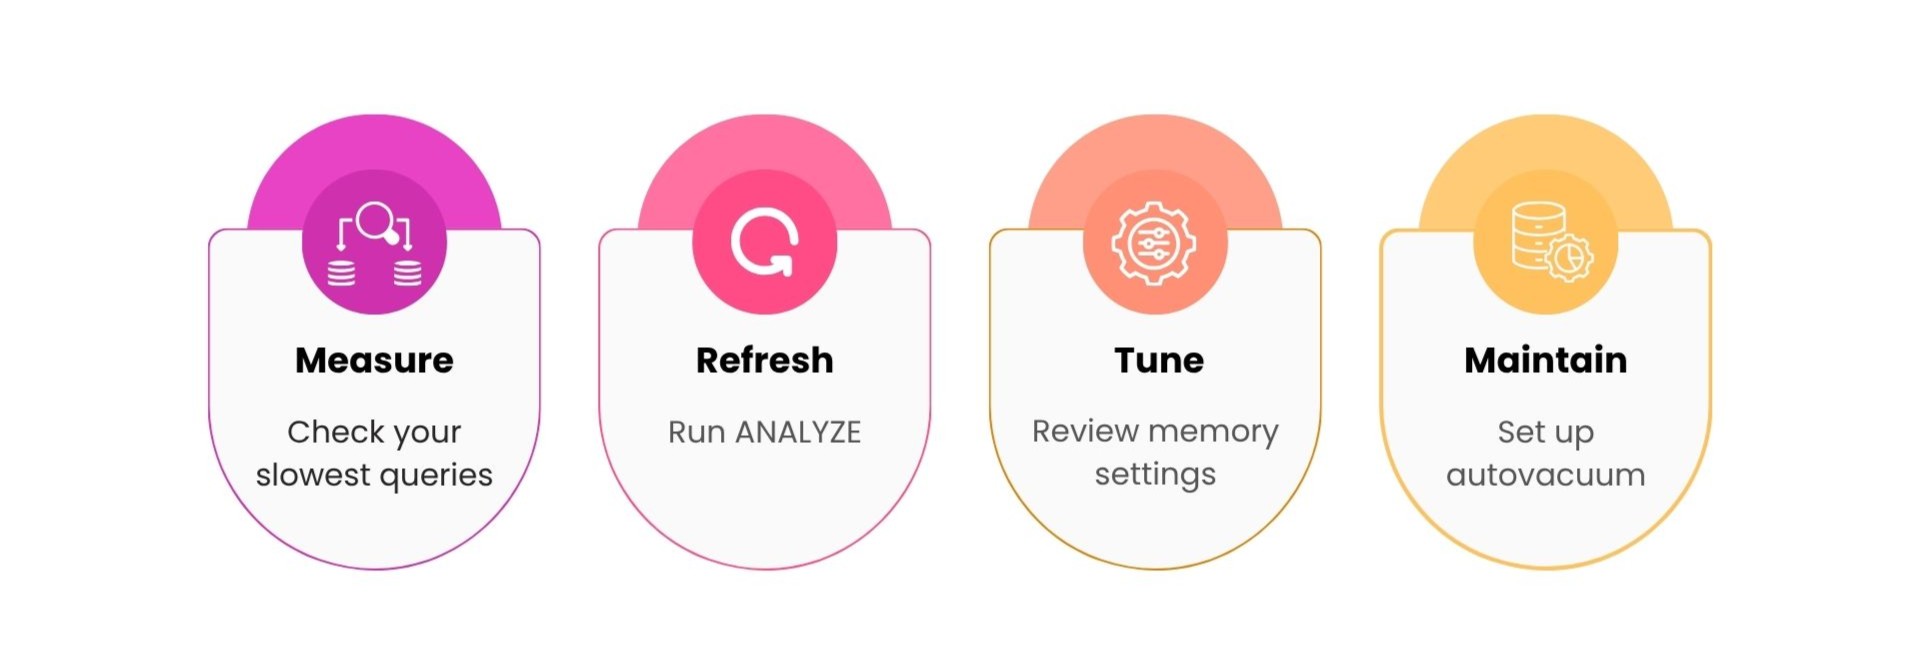
PostgreSQL slows after a migration because the planner works with empty or aged statistics, the target server runs the default configuration, and schema details from the source database affect the execution plans differently. Each of the three has a clear fix.
Does an Empty Statistics Catalog Explain the Slowdown?
Yes. Before PostgreSQL 18, pg_upgrade started the new cluster with an empty pg_statistic catalog, so the planner estimated row counts from defaults until ANALYZE completed.
Major version upgrades change the internal storage format and the system catalog. Optimizer statistics live in that catalog, so they needed rebuilding after the upgrade. The official pg_upgrade documentation instructs you to regenerate them at the end of the process. Teams that include this step in the maintenance window see the new cluster reach its expected speed right away.
Do Default Settings Contribute?
Yes. A freshly provisioned PostgreSQL server uses conservative defaults sized for small machines, so a production host benefits from a configuration review.
Five settings deliver the largest gains:
- shared_buffers: PostgreSQL's own page cache. The default is 128 MB.
- work_mem: Memory for one sort or hash step in a query. The default is 4 MB.
- random_page_cost: The planner's cost estimate for a non-sequential page read. The default is 4.0, which suits spinning disks.
- effective_cache_size: The planner's estimate of the total cache available, covering shared_buffers and the operating system cache.
- maintenance_work_mem: Memory for VACUUM, CREATE INDEX, and similar maintenance tasks.
Do Source-Engine Habits Influence Performance?
Yes. Applications originally optimized for legacy architectures like Oracle, MySQL, or Microsoft SQL Server frequently rely on architectural behaviors that PostgreSQL implements differently. These gaps typically surface during database transitions as mismatched data type mappings, unexpected index choices, or prolonged transaction lengths.
Because PostgreSQL utilizes its own unique storage model, query planner, and execution engine, query behaviors do not automatically translate across platforms.
For instance, the Geopits RetailScan Case Study demonstrates how managing structural shifts, cross-platform encoding gaps, and index optimizations keeps large-scale, high-volume transactional workloads running smoothly during a SQL Server to PostgreSQL migration.
How Do You Find the Real Cause Before Changing Anything?
Capture a baseline with pg_stat_statements, read the slowest plans with EXPLAIN (ANALYZE, BUFFERS), and check when each table was last analyzed. These three views point to the right fix within minutes.
How Do You Build a Baseline with pg_stat_statements?
Enable the pg_stat_statements extension, then rank queries by total execution time. The top ten rows usually account for most of the load. Add the library to shared_preload_libraries (a restart applies it), then create the extension in each database:
CREATE EXTENSION IF NOT EXISTS pg_stat_statements;

SELECT queryid,
       calls,
       round(total_exec_time::numeric, 1) AS total_ms,
       round(mean_exec_time::numeric, 2)  AS mean_ms,
       rows,
       left(query, 80)                    AS query_preview
FROM pg_stat_statements
ORDER BY total_exec_time DESC
LIMIT 10;
How Do You Read a Plan with EXPLAIN (ANALYZE, BUFFERS)?
Reading a PostgreSQL query plan with EXPLAIN (ANALYZE, BUFFERS) requires evaluating the execution tree, real-world timings, row count accuracy, and 8 kB memory block I/O.
EXPLAIN (ANALYZE, BUFFERS)
SELECT o.customer_id, sum(o.total)
FROM orders o
JOIN customers c ON c.id = o.customer_id
WHERE o.created_at >= now() - interval '30 days'
GROUP BY o.customer_id;
PostgreSQL 18 includes BUFFERS automatically in EXPLAIN ANALYZE, which makes cache behavior visible in every plan. Four signals deserve a quick look:
- Estimated vs. actual rows: Large gaps point to outdated or absent statistics.
- Seq Scan on a big table: A sequential scan reads the whole table. An index or a statistics refresh often changes the choice.
- Temp reads and writes: Temporary file activity shows that work_mem is smaller than the step needs.
- Shared reads vs. hits: Reads come from disk or the OS cache, and hits come from shared_buffers.
How Do You Check Statistics Freshness?
Query pg_stat_user_tables for last_analyze and last_autoanalyze. Empty timestamps identify tables the planner has yet to profile.
SELECT schemaname,
       relname,
       n_live_tup,
       last_analyze,
       last_autoanalyze
FROM pg_stat_user_tables
ORDER BY n_live_tup DESC
LIMIT 20;
How Do You Refresh Planner Statistics After pg_upgrade?
Run vacuumdb --all --analyze-in-stages right after pg_upgrade finishes, and add --jobs to parallelize. On PostgreSQL 18, the upgrade carries basic statistics forward, and vacuumdb --missing-stats-only fills in the rest.
How Does vacuumdb --analyze-in-stages Work?
It runs ANALYZE in three passes. The first pass uses the lowest default_statistics_target to produce usable statistics quickly, and later passes build the full-detail statistics.
# Run as the postgres user right after pg_upgrade completes
vacuumdb --all --analyze-in-stages --jobs=4
The --jobs option analyzes several tables in parallel, which shortens the window on large clusters. PostgresAI's guidance adds a useful operational tip: finish a single complete ANALYZE pass inside the maintenance window before opening the gates to application traffic, and automate the step in your runbook so it repeats the same way every time. Include the ANALYZE duration in your maintenance window plan.
What Changed in PostgreSQL 18?
PostgreSQL 18 (released September 25, 2025) preserves planner statistics during pg_upgrade, so the new cluster starts with usable estimates. The PostgreSQL project lists this as the feature "Planner statistics preserved on major version upgrade." PostgresAI tested upgrades from PostgreSQL 14, 15, 16, and 17 to 18 and confirmed that the preservation works across those source versions, because pg_upgrade calls the new cluster's pg_dump.
Source clusters older than version 17 also need a fresh ANALYZE for range type statistics, so the --missing-stats-only pass remains a valuable final step.
How Do You Rebuild Extended Statistics and Partitioned Table Parents?
Run ANALYZE on every table that uses CREATE STATISTICS and on every partitioned parent table. Extended statistics hold multi-column dependencies and distinct counts. pg_upgrade moves their definitions, and ANALYZE fills in the data. Partitioned parents need a direct command because vacuumdb --analyze-only processes the partitions and leaves the parent for you to handle.
-- Find extended statistics objects
SELECT stxname, stxrelid::regclass AS table_name
FROM pg_statistic_ext;

-- Refresh a table that uses them, and each partitioned parent
ANALYZE VERBOSE sales_orders;
Which PostgreSQL Settings Should You Review First?
Start with shared_buffers, work_mem, effective_cache_size, random_page_cost, and maintenance_work_mem. Change one group at a time and measure with pg_stat_statements after each change.
How Do You Size Memory Settings?
Set shared_buffers near 25% of RAM, then size work_mem from the memory left over, the connection count, and parallel workers.
A widely shared sizing formula is:
work_mem = (total_RAM - shared_buffers) / (max_connections * 3) / max_parallel_workers_per_gatherRemember that work_mem applies per sort or hash node, and one query can run several nodes. Raising the value globally multiplies across connections, so measured increments work best. Two helpers make tuning precise:
-- Log every temporary file so undersized work_mem shows up in the log
ALTER SYSTEM SET log_temp_files = 0;

-- Give one heavy report extra memory for a single transaction
BEGIN;
SET LOCAL work_mem = '256MB';
-- run the report here
COMMIT;
How Do You Tune Planner Cost Settings?
Set random_page_cost to 1.1 on SSD or NVMe storage, and set effective_cache_size to your estimate of total cache. These two values help the planner prefer index scans when they are advantageous.
ALTER SYSTEM SET random_page_cost = 1.1;
ALTER SYSTEM SET effective_cache_size = '24GB';  -- adjust to your host
SELECT pg_reload_conf();
ALTER SYSTEM writes to postgresql.auto.conf, and ALTER SYSTEM RESET <name>; reverts a single change. Keep a version-controlled copy of your final configuration so the next migration starts from a proven baseline.
What Should You Know About Asynchronous I/O in PostgreSQL 18?
PostgreSQL 18 adds an asynchronous I/O subsystem controlled by io_method, with worker as the default. The default suits most migrations, so begin there and measure.
The three methods are
- worker: Background I/O worker processes handle reads. This method is the default, with io_workers = 3.
- io_uring: Uses the Linux kernel interface and requires a PostgreSQL build with --with-liburing.
- sync: The traditional synchronous behavior, handy for before-and-after comparisons.
SHOW io_method;

-- Inspect in-flight asynchronous I/O (PostgreSQL 18)
SELECT * FROM pg_aios;
How Do You Tune Autovacuum After a Migration?
Run a manual VACUUM (ANALYZE) on freshly loaded tables, then set per-table autovacuum thresholds for the largest tables so background workers keep statistics and dead-row cleanup current. Cybertec points out a helpful detail: pg_upgrade leaves behind the cumulative statistics that autovacuum and autoanalyze rely on to decide which tables need attention. After an upgrade, those counters start fresh, so a deliberate first pass from you gives the background workers a clean starting line.
How Do You Prepare Tables After a Bulk Load?
Run VACUUM (VERBOSE, ANALYZE) on each loaded table. The command sets visibility information and refreshes statistics in one pass.
VACUUM (VERBOSE, ANALYZE) orders;PostgresAI recommends this command after initial data loads and after any large content change, because it combines both maintenance tasks.
How Do You Set Per-Table Autovacuum Thresholds?
Lower autovacuum_vacuum_scale_factor and autovacuum_analyze_scale_factor on large tables so autovacuum triggers sooner.
ALTER TABLE orders SET (
  autovacuum_vacuum_scale_factor  = 0.02,
  autovacuum_analyze_scale_factor = 0.01
);
The global defaults wait for a percentage of the table to change, which on a table with hundreds of millions of rows means a long wait. Per-table settings give those tables a tighter cycle.
How Do Long Transactions Affect Cleanup?
Long-running transactions hold back VACUUM, because dead rows stay visible to them. Shorter transactions release those rows for cleanup. Applications ported from other engines sometimes keep transactions open for long stretches. This query lists the oldest ones:
SELECT pid, usename, state, now() - xact_start AS xact_age, left(query, 60) AS query_preview
FROM pg_stat_activity
WHERE xact_start IS NOT NULL
ORDER BY xact_start
LIMIT 10;
How Do You Fix Schema Differences from Oracle or MySQL Migrations?
Align data types, recreate the indexes your queries depend on, and update extensions. Heterogeneous migrations carry the most schema-driven performance gains.
How Do You Choose the Right Data Types?
Map each source type to the PostgreSQL type that matches how the column is used. Exact numeric types and matching join-key types let the planner use indexes confidently. AWS Database Blog authors note that AWS SCT converts Oracle NUMBER without precision to double precision, while NUMBER(p) becomes numeric(p). Reviewing those choices column by column pays off, especially for keys.
Post-Migration Performance Checklist
Download your checklist below
How Long Should Post-Migration Performance Tuning Take?
The time required depends on the database size, workload complexity, severity of the slowdown, and the cause identified during diagnosis. A focused investigation can begin with query statistics and analyzing SQL Server execution plans to pinpoint resource bottlenecks. For long-term query tracking and diagnostic history, setting up the SQL Server Query Store is highly effective.
Conclusion
Post-migration performance follows a repeatable path: refresh statistics, measure with pg_stat_statements, tune settings against your hardware, prepare autovacuum, and align the schema with PostgreSQL's strengths. PostgreSQL 18 shortens the first step by preserving planner statistics, and the checklist above works for every version. Save the final configuration and the baseline comparison in your runbook, and your next migration starts from a proven playbook.
Need help optimizing your migration? Contact a Geopits advisory expert to ensure your post-performance tuning and database transitions run at peak efficiency.
Frequently Asked Questions
1. Why Is PostgreSQL Slow After pg_upgrade?
The new cluster starts with an empty statistics catalog (on versions before 18), so the planner uses default estimates. Running vacuumdb --all --analyze-in-stages restores accurate estimates.
2. How Long Does ANALYZE Take?
Duration scales with database size and default_statistics_target. Staged analysis delivers usable statistics within the first pass, and --jobs further shortens the total. Time a rehearsal run on a copy of production to plan your window precisely.
3. Do I Still Need ANALYZE After Upgrading to PostgreSQL 18?
A targeted pass remains valuable. PostgreSQL 18 carries basic statistics forward, and vacuumdb --all --analyze-only --missing-stats-only completes extended statistics and any other missing entries.
4. Should I raise shared_buffers to speed things up?
Setting it near 25% of RAM suits a dedicated server. Huge values duplicate pages already held by the operating system cache and reduce room for work_mem, so measured steps work best.
5. Is Autovacuum Enough After a Migration?
Autovacuum handles ongoing maintenance, and a manual first pass gives it a clean starting point. Run ANALYZE and VACUUM (ANALYZE) yourself right after cutover, then let autovacuum take over.
Vimal V