.svg)
.svg)
.svg)


.svg)


.svg)
.svg)

.svg)

As a DBA, we will face lots of performance issues because of poorly configured server configuration, database settings, missing indexes, inefficient query, fragmented index etc.
In this blog, we will look into the wait stats CXPACKETS occurrence and analyse whether it is improving or degrading our performance.
Most CXPACKETS appear because of parallel processing.
In parallel processing, a query is divided into multiple threads that are executed in parallel, this is called Parallel Processing.
Why do we need parallel processing?
For example, suppose we have a query that takes 5 minutes to complete with the help of a single CPU. If that same query is divided into multiple threads and then executed in parallel on more than one CPU, it may improve the performance.
Once the process is divided into multiple threads, one main thread (thread 0) takes care of the remaining threads created during parallel execution.
This thread 0 makes sure that the remaining threads complete their tasks and are involved in final delivery.
There are lots of things that need to be considered in parallel processing. Some of them are shown below:
- CPU Cores
- I/O rates of disk
- Indexing
- Page Fragmentation
1. CPU Cores:
In parallelism, multiple threads are created for a particular process and get executed on the CPU cores based on the MAX DOP and Cost threshold for parallelism values.
DOP defines how many CPUs need to be utilized. Default value is Zero (Use all CPU). Max DOP needs to be set based on the CPU cores available and baseline analysis.
Cost threshold for Parallelism defines which processes need to be executed in parallel. Based on baseline analysis of query cost and CPU workload, we define its value. Default value is 5.
Sometimes a query that runs on a single CPU can perform better compared to multiple CPUs.
Below example shows how the same query is executed on single and multiple CPUs, how much CPU time it has utilized, and the occurrence of CXPACKETS.
At first we will check the values of Max DOP and Cost threshold for parallelism.
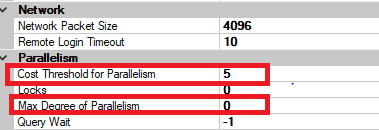
Now we start to execute a query on the AdventureWorks2012 database. Before executing, be sure that the actual execution plan is enabled.
Set statistics IO ON
Set statistics Time ON
Use AdventureWorks2012
Select * from sales.salesorderdetails order by lineTotal Desc
GO
Actual Execution plan
As you can see, parallelism happens for our query as the cost threshold for parallelism is more than 5.
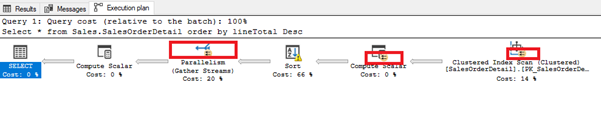
In the above execution plan, the clustered index scan is responsible for fetching the rows, hence I selected that and pressed F4 to view the properties window.
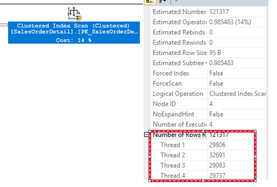
As you can see, based on my CPU cores, 4 threads are created and the query is executed in parallel.
Now we will check the CXPACKETS wait type using the command shown below.
Select * from sys.dm_os_wait_stats Where wait_type = 'cxpackets'

As you can see, parallelism happened and the wait time is about 8705 ms.
CPU Execution time
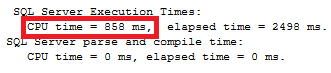
Now we will check how it behaves for a single CPU. For that, I am adding a hint of max DOP to 1.
Before executing, reset the CXPackets counter values by using the command below.
Please note: Don't execute this on a production environment.
DBCC SQLPERF('sys.dm_os_wait_stats',clear)
Use AdventureWorks2012
select * from sales.SalesOrderDetail order by LineTotal desc option (maxdop 1)
Actual Execution Plan

As you can see, parallelism did not happen since I forced the optimizer to use a single CPU by setting MAX DOP to 1.
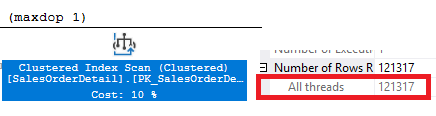
Now we will check the CXPACKETS wait type using the command shown below.
Select * from sys.dm_os_wait_stats Where wait_type = 'cxpackets'

As you can see, no CXPackets occurred. If you find higher numbers of CXPackets, then something needs to be analyzed.
CPU Execution Time
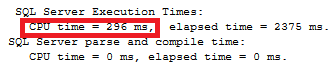
As you can see, CPU time gradually decreased while executing on a single processor. Here the total elapsed time is the same for both, but CPU workload is high with parallelism.
2. I/O rates of disk:
In multiple storage designs, both physical storage systems should have the same transfer rate.
If one storage system performs faster and one performs slower, this will create more CXPACKETS waits.
In this case, the thread accessing the faster storage can get its work done quickly, while the thread accessing the slower storage takes longer.
The CXPACKETS wait type indicates that a thread is waiting for the remaining threads to complete their task.
3. Indexing:
As we know, creating an index can improve I/O performance.
For example, if we are joining multiple tables and one of the tables doesn't have an index, the thread accessing that object may take some time to fetch the row. So the rest of the threads need to wait for that particular thread to complete its job.
So creating proper indexes plays a role in high CXPACKETS wait time.
4. Page Fragmentation:
Due to a high volume of update and delete transactions, page splits happen more often, which leads to data being scattered. This may significantly degrade I/O performance and memory utilization.
The multi-threaded process accessing an object affected by fragmentation can cause more CXPACKETS waits.
Reference: Amit Bansal, https://www.youtube.com/user/SQLMaestros/videos
Arunachalam C
.svg)
.svg)